How I made "The Probability Times"
Turning stochastic election predictions into concrete realities
If you landed here before checking out the project, head here first: theprobabilitytimes.com
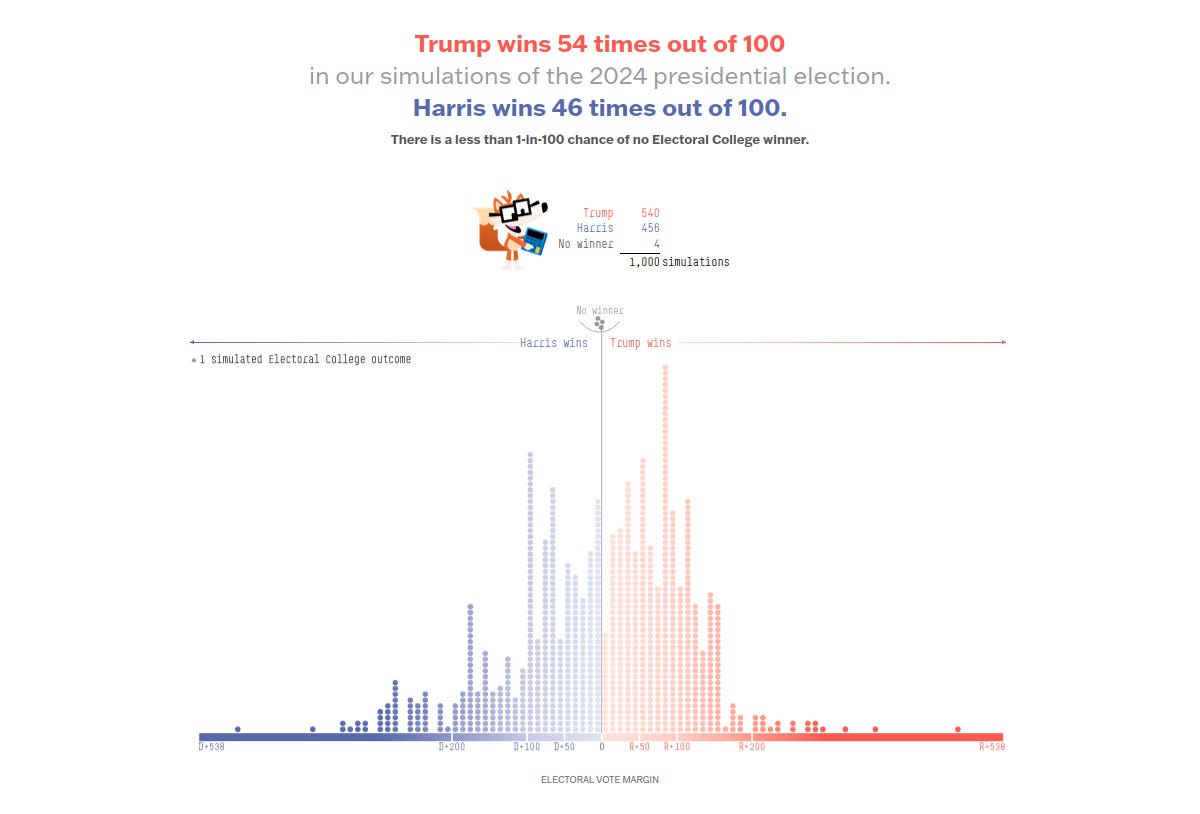
FiveThirtyEight publishes this incredibly cool forecast about the upcoming presidential elections in the US:
Let’s break down what we are seeing here:
They ran a thousand simulations
Each dot in the graph represents one simulation outcome
A total of 538 electoral votes are at stake
A candidate wins if they collect more than 269 (538 / 2) votes = red/blue
Four simulations result in a tie (grey)
Statistics like this are fun, but they present a reality in which candidates have a probability of winning, which is not something that will actually happen.
Making statistics into reality
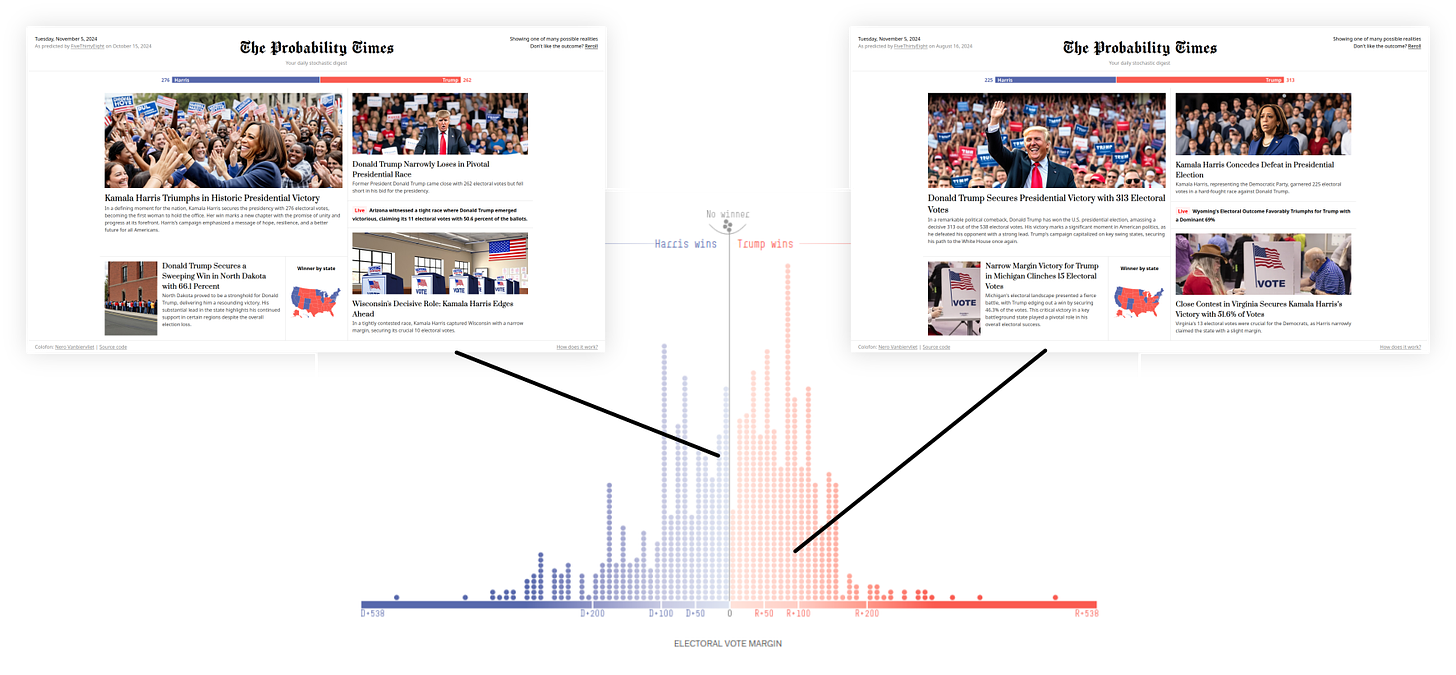
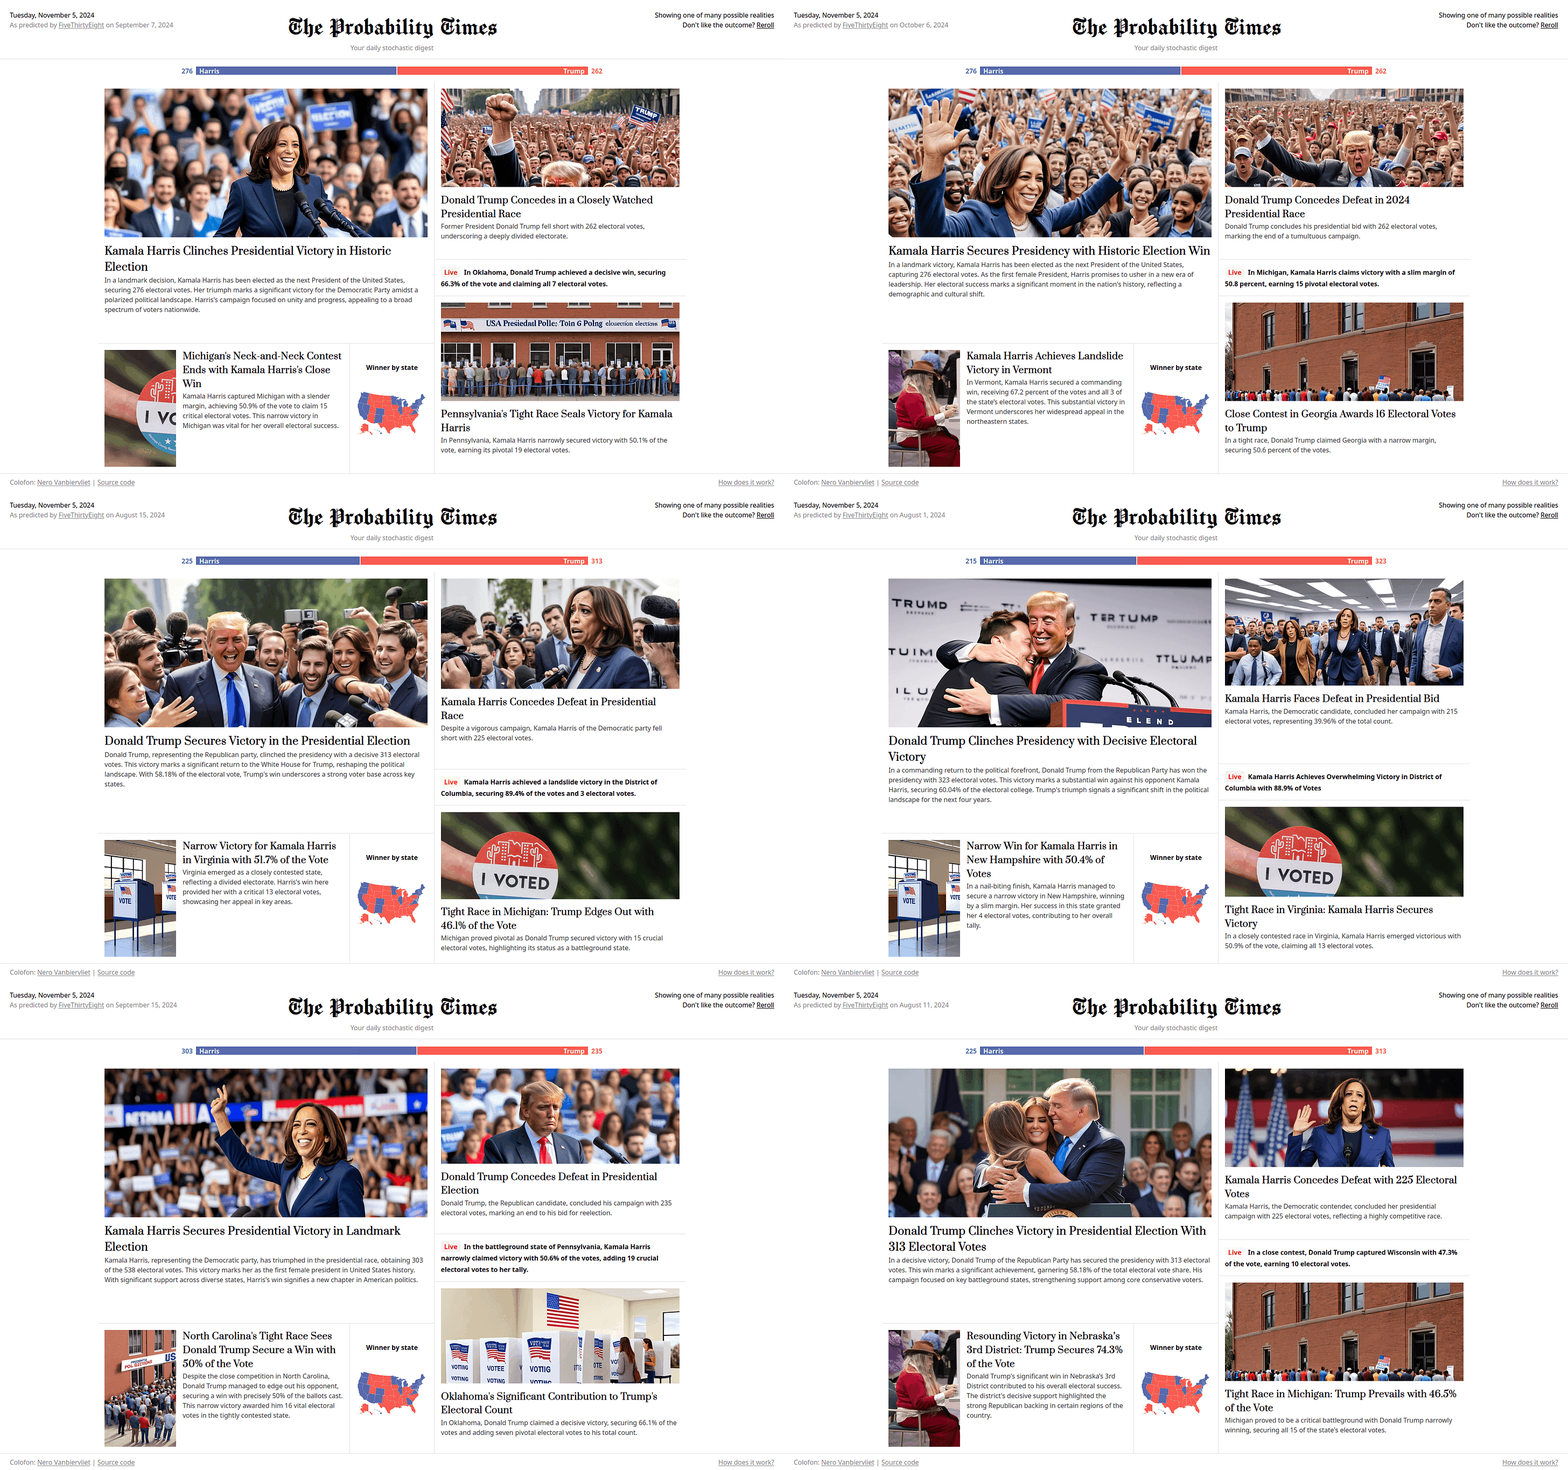
Life is not statistical. Things happen or they don’t. So the initial idea was to turn each of the dots into a newspaper homepage, which shows you a real election outcome:
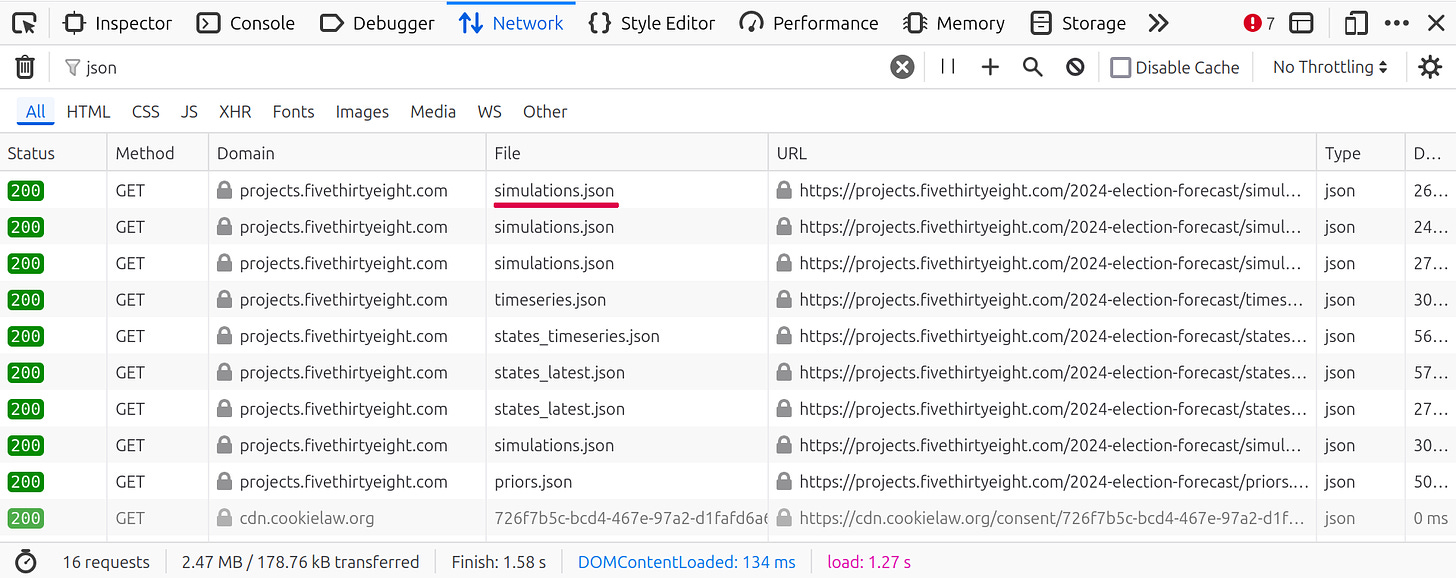
Opening up the network traffic on FiveThirtyEight’s website quickly reveals the raw data behind the forecast:
But upon a closer look, the data for each simulation only contains the electoral college votes “ec” and the popular vote “pv”. To fill a newspaper homepage with rich content, I need more raw information than just the winner and the number of votes.
{
    "ec": {
      "dem": 257,
      "rep": 281
    },
    "pv": {
      "dem": 51.03,
      "rep": 48.97
    }
},
Taking an alternative route
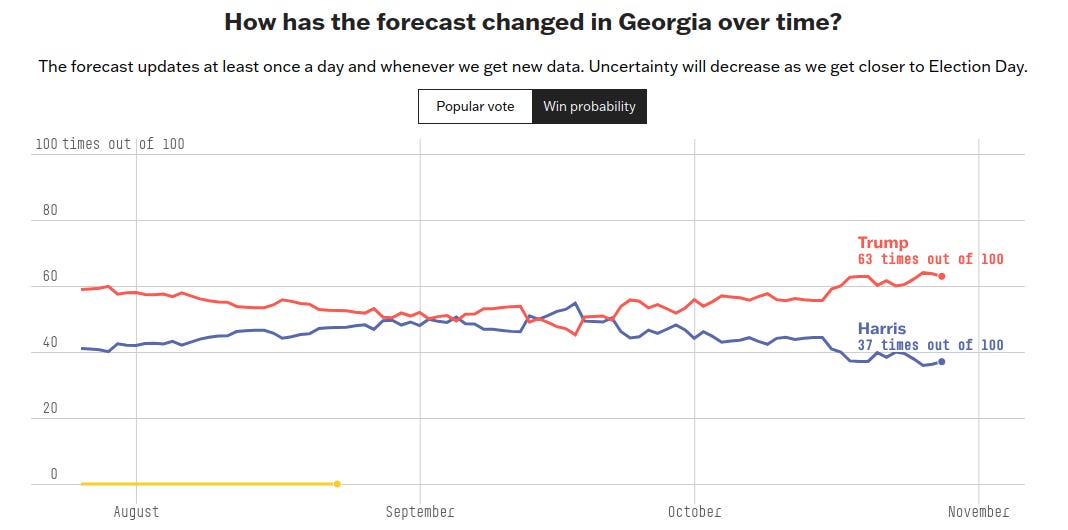
Browsing their website, I noticed there was a second kind of graph, showing a forecast for an individual state over time (e.g. Georgia pictured below).
This data is also available as a clean JSON file called states_timeseries.json. If I put together the simulation of each individual state, I should be able to come up with a result for the country as a whole. I put together a python script that does exactly this.
The result is a summary of the election result for each date, and key insights about closest and biggest wins:
{
  "2024-10-28": {
    "total": {
      "dem": 251,
      "rep": 287
    },
    "closest": [
      {
        "code": "GA",
        "state": "Georgia",
        "winner": "rep",
        "votes": 16,
        "dem": 49.1,
        "rep": 50.9
      },
      ...
    ],
    "biggest": [
      {
        "code": "DC",
        "state": "District of Columbia",
        "winner": "dem",
        "votes": 3,
        "percentage": 92.5
      },
      ...
    ]
  },
  ...
}
That’s neat. Seems like a good enough briefing for a journalist to write articles for eighty homepages.
Hiring an AI copywriter
I decided to hire OpenAI’s GPT-4o for the job. This is what the prompt looks like for the headline article:
You are a professional and respected journalist working for a high-end, unbiased newspaper.

Today, the Donald Trump, from the Republican party, won the election with 313 of the 538, meaning 58.18.

Kamala Harris of the Democratic lost the election with 225 votes, which is 41.82 of the total votes.

Return only JSON, in the following shape:

"headline": {

  "title": "<Title for headline article about the election winner Donald Trump>",

  "text": "<Three sentence supporting text>"

}
(Yes, “the Donald” is a typo, and not a reference to the identically named 2016 subreddit)
The actual prompt is slightly larger, also asking for articles about
a big win in a certain state, and
two states where the election results were very close
The next piece of the puzzle is to get nice pictures to go with the articles.
Coercing an AI photographer to make professional pictures
Asking ChatGPT or Gemini to create an image of Trump does not work out well:
It looks like these companies don’t want to get involved in politics. Smart.
Jumping onto Civit AI, I did find a way to make images of Trump and Harris. After experimenting with a few models, I got the best results with Juggernaut XL.
The model (as almost any AI?) tends to generate overly saturated, vibrant and expressive images. Tuning the model down with a negative prompt helps to get some “normal pictures”.
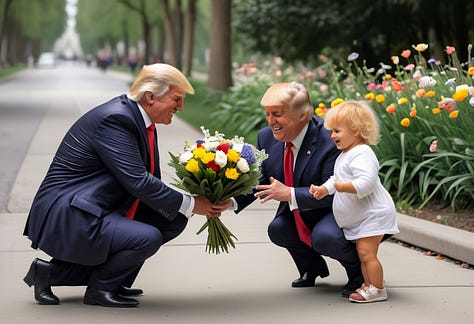
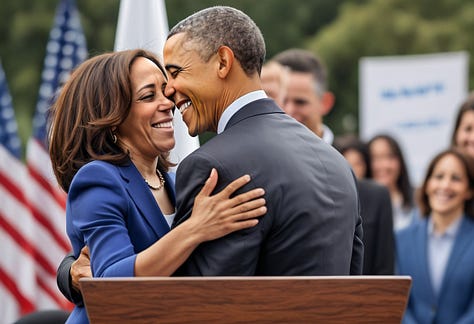
I wrote 5–10 prompts for both Trump and Harris, for the case of winning and losing the election. I had to do some heavy selecting, filtering out some beauties like the images below that did not make it to the final website:

Putting it all together
Packing everything into a small React app using Vite, gives a pretty cool result. Each page refresh loads FiveThirtyEight’s forecast of a random day in the past. Which in turn produces as a different reality, each one probable.
Thanks for reading!
— Nero




love it